Why monitor?
Enables alerts when things go wrong, preferably before they go wrong. So that somebody can have a look at it. It provides insight to enable analysis, debugging, and resolution of the issue. It enables you to see trends/changes over time. For example, how many active sessions at any given time. This helps in design decisions and capacity planning.
Monitoring usually relates to events. An event could include receiving an HTTP request, sending a response, reading from disk, a user login. Monitoring a system could include profiling, logging, tracing, metrics, alerting & visualization.
Blackbox vs. Whitebox monitoring
Monitoring falls under two main categories:
Blackbox monitoring
In Blackbox monitoring, the monitoring is at the application or host level as they are observed from the outside. This can be quite limiting.
Whitebox monitoring
Whitebox monitoring means monitoring the internals of a service. It would expose data about the state and performance of the internal components.
The four golden signals
According to Google, if you can only measure four metrics of your user-facing system, focus on the following four, called the Four golden signals:
#1. Latency
The time it takes to serve a request- successful or failed. It is important to track not just successful requests but also failed ones.
#2. Traffic
A measure of how much demand is being placed on your system. For a web service, this is usually HTTP requests per second.
#3. Errors
The rate of requests that fail.
#4. Saturation
How full your service is. Latency increase is often an important indicator of saturation. Many systems degrade in performance much before they achieve 100% utilization.
Prometheus metrics types
Prometheus metrics are of four main types :
#1. Counter
The value of a counter will always increase. It can never decrease, but it can be reset to zero. So, if a scrape fails, it only means a missed datapoint. The cumulative increase would be available at the next read. Examples:
Total number of HTTP requests received The number of exceptions.
#2. Gauge
A gauge is a snapshot at any given point in time. It can both increase or decrease. If a data fetch fails, you lose a sample; the next fetch might show a different value: examples disk space, memory usage.
#3. Histogram
A histogram samples observations and counts them in configurable buckets. They are used for things like request duration or response sizes. For example, you could measure request duration for a specific HTTP request. The histogram will have a set of buckets, say 1ms, 10 ms, and 25ms. Rather than storing every duration for every request, Prometheus will store the frequency of requests that fall into a particular bucket.
#4. Summary
Similar to histogram samples observations, typically request durations or response sizes. It will provide a total count of observations and a sum of all observed values, allowing you to calculate the average of observed values. For example, in one minute, you had three requests that took 2,3,4 seconds. The sum would be 9, and count would be 3. The latency would be 3 seconds.
Components of Prometheus ecosystem
The Prometheus server
Collects metrics, stores them, and makes them available for querying, sends alerts based on the metrics collected.
Scraping
Prometheus is a pull-based system. To fetch metrics, Prometheus sends an HTTP request called a scrape. It sends scrapes to targets based on its configuration. Each target (statically defined, or dynamically discovered) is scraped at a regular interval (scrape interval). Each scrape reads the /metrics HTTP endpoint to get the current state of the client metrics and persists the values in the Prometheus time-series database.
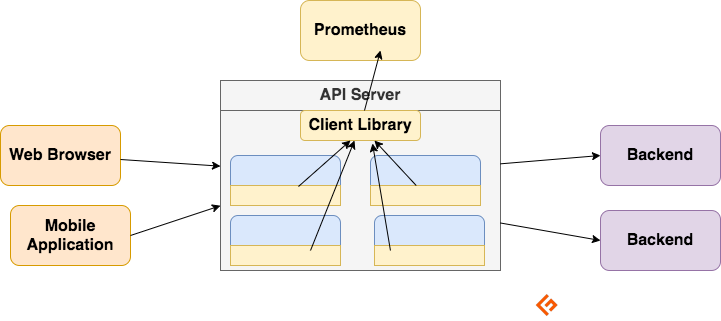
Client libraries
To monitor a service, you need to add instrumentation to your code. There are client libraries available for all popular languages and runtimes. Using these libraries, once you add a few lines of code, your code can start emitting metrics. This is called direct instrumentation. These libraries enable you to define internal metrics and also expose them via an HTTP endpoint. When Prometheus scrapes the metrics HTTP endpoint, the client library sends the metrics to the server. Official client libraries are offered by Prometheus for Go, Java, Python, and Ruby. Prometheus has an open ecosystem. There are also community built client libraries available for C, PHP, Node.js, C#/.NET, and many others.
Exporters
Many applications expose metrics in non-Prometheus format. For these and for applications that you do not own or for which you do not have access to code, you cannot add instrumentation directly. For example, MySQL, Kafka, JMX, HAProxy, and NGINX server. In these scenarios, you make use of exporters. An exporter is a tool you deploy along with the application you want metrics from. An exporter acts like a proxy between the application and Prometheus. It will receive requests from the Prometheus server, collect data from the access logs, error logs of the application, transform it into the correct format, and finally return to the Prometheus server. Some of the popular exporters are:
Windows – for Windows server metrics Node – for Linux server metrics Blackbox – for DNS and Website performance metrics JMX – for Java-based application metrics
Once the applications have been instrumented, or the exporters are in place, you need to tell Prometheus, where they are. This can be done using static configuration. In the case of dynamic environments, this cannot be done; therefore service discovery is used.
Alerting
Alerting with Prometheus consists of two parts – Alerting rules send alerts to the Alertmanager. The Alertmanager then manages those alerts. It sends out notifications using many out-of-the-box integrations like email, Slack, Hipchat, and PagerDuty. The Alertmanager can also perform silencing or aggregation to reduce the number of notifications. Here is the guide to monitoring the Linux server using Prometheus and Dashboard.
Visualizing with Dashboards
Prometheus has a number of APIs using which PromQL queries can produce raw data for visualizations. Though Prometheus includes an expression browser that can be used for ad-hoc queries, the best tool available is Grafana. Grafana fully integrates with Prometheus and can produce a wide variety of dashboards. You will need to configure Prometheus as the data source for Grafana. You can add dashboards by:
Importing community-built dashboards Building your own Using a predefined dashboard.
This is how a predefined node exporter dashboard looks like:
Grafana has a worldPing module that lets you monitor site and DNS performance metrics worldwide.
Summary
Prometheus has very few requirements. It can be quite simple to run as it is a single binary with a configuration file. It can handle thousands of targets and ingest millions of samples per second. Prometheus is designed to track the overall system, health, behavior of the system. Grafana is the best tool available for visualization of metrics and integrates seamlessly with Prometheus.
![]()
![]()


![]()
![]()
![]()
![]()

![]()


![]()
![]()
![]()

