Telling a compelling story by slicing and dicing data has become an essential skill for any career and business. If you want to secure a job in a reputed brand, you must prove what you can do for the company by showing data-based facts. Or, if your brand is selling something, you must flaunt, backed by data, how your product/service can make a difference. Do you also want to get your feet wet in data visualization and become successful as a professional or business? Read this article until the end!
What Is Data Visualization?
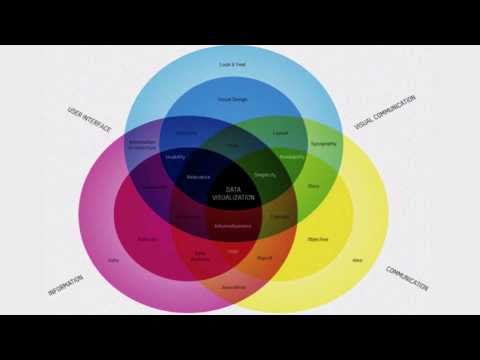
When you graphically represent data in an easily understandable visual format, that is data visualization. In this process, data scientists and analysts use various data visualization elements like graphs, charts, pivots, heat maps, maps, and more. The objective is to make data more accessible and understandable to the audience. Employees, managers, and stakeholders can easily point out patterns, trends, and outliers in correctly visualized data slides. You will find data visualization everywhere in your personal and professional life. The colorful dashboards that you see in the workout, finance, stock market, smart home utility, traffic navigation, etc., apps are the results of data visualization.
How Does Data Visualization Work?
Data visualization works by transforming numbers into easily understandable visuals. If you explain the upward trend of ambient temperature in a day using simple numbers, people will hardly understand it. However, when you draw a line chart from the input data and show that the temperature keeps on increasing from the morning, attains a peak, and then drops as night approaches, the graph will create an inverted V shape. The audience will now easily understand the movement of temperature throughout the day. Data visualization works because:
People easily digest images like shapes, colors, photos, drawings, etc., as compared to numerics and texts in a spreadsheet. Graphs, maps, charts, etc., are visual metaphors. Since human beings process visuals faster than texts, they can easily connect the dots during data visualization. Raw data itself in a database or spreadsheet tool does not hold any value. When you organize the raw data and visualize it, you are adding value to the data. Visualized data is actionable information and the audience can use it to solve problems or make decisions.
Why Is Data Visualization Important?
It helps to absorb information quickly. Since you get visual queues, information processing, insight extraction, and decision-making become effortless. You can share visualizations with external and internal collaborators with a few clicks. Identification of correlations between independent variables becomes an easy task. You can break down complicated data into simple chunks and then visualize them to make sense easily.
Various Types and Examples of Data Visualization
#1. Line Graphs
You need to use line charts or graphs to visualize time series data. They are highly similar to scatter plots but showcase data points that are separated via time intervals. Line graphs join segments using lines and hence the name.
#2. Area Charts
Similar to line charts, data scientists use area charts to track data over time. However, the tool colors the plotted area between the lines for multiple items. To measure overall volumes, like volumes of various products sold in various countries, you can use this data visualization type.
#3. Network Graphs
Network graphs consist of networks, nodes, interactions between networks, and pathways to form highly complex graphics. If you need to spot patterns between networks of clusters, then you can use this data visualization format.
#4. Geographical Maps
You can present and explain location-specific data easily and meaningfully using a geographical map-type data visualization. You will mostly see the distribution of volume-based data on human beings, like vote share, gender share, internet coverage, electricity coverage of sanitation, etc., in geographical maps.
#5. Treemaps
Treemaps use nested rectangles to visualize hierarchical data. Such diagrams use screen space efficiently. Hence, you can compare hundreds of groups and their performance figures on a single screen. The visualization model also utilizes various shades and temperatures of colors to represent the performance figures each group carries.
#6. Bar Chart
Bar graphs or charts help you to visualize categorical data against distinct values. On the X-axis, you need to place the items you are observing. Then, on the Y-axis, you plot the values of the corresponding items. Thus, you get vertical bars. The more the value of an item, the higher the bar is.
#7. Gantt Chart
Gantt chart is the most common type of data visualization you can find in project management. It is the horizontal variant of the bar chart. Gantt chart visualizes tasks and their progression against the duration of each task. The horizontal length of the bars depends on the start, progression, and end of a task.
#8. Pie Chart
This data visualization type presents data in a circle-shaped graph. When you need to compare different products or services according to their revenue earnings, you can use this chart. Here, you consider the whole cell area as 100%. Then, according to the percentage value of each item, you distribute them throughout the cell area.
Use Cases of Data Visualization
Identifying Trends and Spikes
The primary use case is to identify trends, patterns, relationships between products/services, etc., from a raw dataset. If you see any sudden increase in trends throughout a long-term data set, you can consider that events spikes during those intervals. For example, during the Black Friday event, you may quickly notice a spike in product/service sales across eCommerce platforms.
Monitoring Goals
Data scientists create interactive dashboards using data visualization. These dashboards could show you productivity, resource utilization, performance metrics, sales, marketing ROI, etc. You can also make minor selections and modifications in the dashboard for custom visualization of data points.
Accessing Data
Businesses need to feed information to their employees in a digestible format. Here you can also utilize data visualization. In place of raw data, you can send various charts and graphs for sales, marketing, budget, revenue earnings, overhead expenses, etc. Now, find below the best practices you should follow to make your data visualization storytelling project successful:
Target Audience Specification
You must create a data visualization presentation by analyzing the target audience. If the audience is coming from a strong technical background, you can include complex visualization tools like Network Graphs, Histograms, Treemaps, Gantt Charts, etc. These groups of participants could be professionals, teachers, scientists, executives, etc., and they are aware of complex data visualization tools. On the contrary, if you present your findings to a non-technical audience, stick to simple charts like Scatter Plots, Bar Charts, Line Charts, etc. This audience group mostly ends users, bystanders in a marketing event, prospects, leads, etc., who understand data with visual queues. They may not know the underlying principles of the charts and graphs you use.
Define the Purpose
Whether you use one or many visual charts in your presentation, ensure you define the purpose of each graphic. Do not leave it to the audience. If you do, you may not get the attention you want from them. For instance, in the above Google Analytics Marketing Website data visualization, there are four graphics: line charts, geographical maps, horizontal bar graphs, etc. Now, if you look at the image carefully, you will see various definitions for each visualization.
A line chart for site session trend A geographical map for country-wise trend A horizontal bar chart for channel-based trend
Using the Right Visualization Elements
Different charts have varying use cases. You can not use a Network Graph in place of a Bar Graph. Hence, understand the data and then select a visualization method. Refer to the “Data Visualization Types and Examples” section above for more guidance on choosing the right graph. These days, many data manipulation tools like Google Sheets, Excel, etc., provide 3D versions of many common charts and graphs. For example, a 3D pie chart. However, using 3D charts have various limitations. Sometimes, a 3D pie chart does not visualize the data the way you should do it. In a 3D plane, you need to put multiple labeling as well. Finally, you could distort the visualization and the story. Hence, stick to 2D charts and graphs since the audience understands these easily.
Correct Labeling
Do not forget to label the graphs and charts that you use in your data visualization project. For example, you must mention the values for the X/Y-axis, names of the items, legends, data collection time frame, etc. In the above image, you will find labels for each element in the data visualization slide. It helps the audience to read the charts, graphs, and tables. Whenever you are using 2D bars and charts, ensure you start the graph from the X and Y intersection where both are zero. If you invert this and start from a point where Y-axis is not zero, the visualization could mislead the user.
Digestible and Simpler Data Points
Include only a few visualizations with data per screen. Rely mostly on images, illustrations, and videos to tell the story. When explaining data points, use common terms instead of industry terminology. For example, in the above image for Google Ads Overview Report, we have only used four tools to visualize data: dashboards, line charts, pie charts, and a table. However, you can improve the same visualization by explaining the industry terms like CTRs, Impressions, Conversions, etc.
Correct Usage of Color and Fonts
You must use different colors to separate data points. When using colors, ensure that the overall slide looks soothing to the eyes. Do not use highly contrasting colors. The audience will feel fatigued in their eyes while looking at the charts for a long time. Also, use easily readable typefaces for the numbers and alphabets. Use Sans Serif fonts as they look much better when you are presenting large sets of data. Furthermore, try to use a large and bold font so the audience can easily visualize the data.
Creating a Narrative
Your data-based storytelling needs a narrative or storyline. Start with a compelling issue that the audience can personally relate to. Then start explaining the numbers that your product/service generates. Finally, pith your product/service as a solution. You can create a great narrative using the followings:
A trend line to visualize the losses over time A comparison chart to show how your product differs from the others Create a rank order table to show that your product sits at the top when comparing various features with other products A scatter plot to show that the client’s business growth is proportional to the usage of your products or services
Follow Standard Visual Designs
Your audience in the Western Hemisphere reads from left to right, then top to bottom, again left to right. This reading pattern is known as the Z-pattern. Hence, if you are targeting western countries, place your graphics in a Z-pattern. Thus, put the first chart at the upper left side of the slide. Then to its immediate right, put another data visualization that relates to the chart on the left side. Now, place the next related graph in the bottom left corner and the final chart on the right side at the bottom.
Sync the Data Storytelling
The data you are presenting must support your storyline. Sometimes, website glitches or email security systems may restrict content or images. Then the audience will not be able to understand the graphical representation of data. Hence, labeling is important so that the audience can understand the story directly from the visual elements.
Use a Data Visualization Tool
You can undoubtedly visualize from scratch using spreadsheet apps like Microsoft Excel or Google Sheets. However, there are more advanced and intelligent data visualization tools available in the market. In such tools, you just import the raw data, define a use case, and get formatted visualizations in a few seconds. You can check out tools like Tableau Public, Looker Studio, Microsoft Power BI, Open Refine, etc.
Wrapping Up
So far, you have gone through the basics of data visualization, like its definition, types, working method, importance, use cases, and examples. Further, you have learned the best practices of data visualization that you must follow to tell a compelling and engaging story using business data. Next up are the best business intelligence tools and the FusionCharts data visualization tool that you may not want to miss.
![]()
![]()


![]()
![]()
![]()
![]()

![]()


![]()
![]()
![]()

